
An IOI Private Coaching client and I are just working through the valuation section of the course, and for the practicum portion, we decided to analyze a U.S. brokerage and market making firm called Interactive Brokers (IBKR).
Interactive Brokers is a fascinating company, perfect for someone interested in option investing.
First, its business has to do with the trading and clearance of option contracts (among other things) and second, we have discovered that owning its business allows an investor a call option on large changes in market volatility.
This article is a brief overview of some of the work we have done to analyze two of its valuation drivers: revenue growth and profitability.
An old-school saying in the brokerage business is ?Bulls make money. Bears make money. Pigs get slaughtered.?
In other words, if you are a broker, you can make money in up markets and down just as long as you don?t get too greedy and make too many directional bets. Interactive Brokers has taken that dictum to heart and applies cutting edge technology to this age-old maxim to create a very nice business.
Segments
Interactive Brokers operates two segments?Brokerage and Market Making. The Brokerage segment deals with everything involved in the lifecycle of a securities transaction such as order capture and routing, execution confirmation, and settlement and clearing. The Market Making segment is involved in acting as an intermediary that takes the opposite side of trades and earns the difference between the bid / ask spread in return.
Revenues
Revenue growth at the two segments appear as in figure 1 when graphed out:
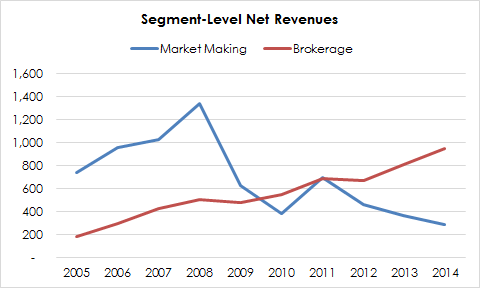
Figure 1. Source: Company statements, IOI Analysis
Here, we see a steady, consistent revenue growth in the Brokerage segment coupled with highly variable revenue change in the Market Making segment.
In looking at correlations between revenue drivers, it is unsurprising that Brokerage revenues have a strong correlation (97%, r-squred of 94%) with overall volume of contracts (in the case of options and futures) and shares (in the case of stocks) processed.
On the Market Making side, we realized that there is a 57% correlation between the VIX spread (i.e., the difference between the high and low value of the VIX each year) and segment revenues (the r-squared value of 32.3% means that roughly one-third of the variance in Market Making revenues can be explained by the VIX spread); in addition, there is a 69% correlation between segment volume and segment revenues (r-squared value of 47%).
Looking at Interactive Brokers? revenue from the component parts of price and volume, we can see that at IBKR?s core is the Brokerage business. This business?s product is completely commoditized, so the firm is a ?price taker? whose revenues are completely dependent upon volumes.
The other part of IBKR?s business does have pricing power in certain circumstances: periods of large changes in market volatility. As markets become more volatile, market makers can charge a greater spread between securities? bid and ask prices?in effect, raising prices as demand for transactions increase. In a real sense, this facet of Interactive Brokers offers an investor a call option on market volatility. If market volatility increases sharply, IBKR?s Market Making revenues will also see a boost, in other words.
Profits
This analysis is one that looks not at IOI?s preferred measure of profitability?Owners? Cash Profits?but rather on segment level Earnings Before Interest and Tax (EBIT).[1]
A graphical overview of the segment-level EBIT margins are below, in figure 2.
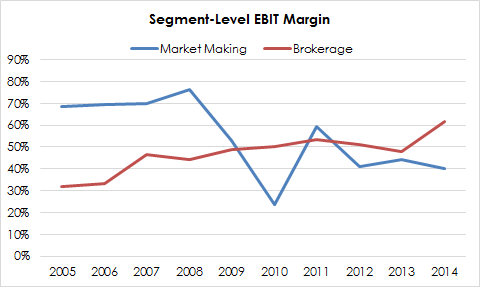
Figure 2. Source: Company statements, IOI Analysis
The two things that stood out to us looking at this chart were the apparent similarity between the line for the Market Making segment?s EBIT Margin and that representing its revenues. Indeed, the correlation between this segment?s revenues and its EBIT margin was over 99% (r-squared of 99%). We look below at operational leverage, but in general, we can see that the theme of increasing market volatility being helpful to IBKR?s business continues at the bottom line in the same way that it did on the top.
The other notable feature of this chart is the two apparent steps up in profitability for the Brokerage business over the time shown here. The jump from the 30% range to the 50% range occurred in 2007; margins remained consistently at that 50% level for the next seven years, and only last year jumped by 10 percentage points?to the 60% range. Looking into the root cause for this jump, we graphed out total brokerage volumes and something interesting turned up:
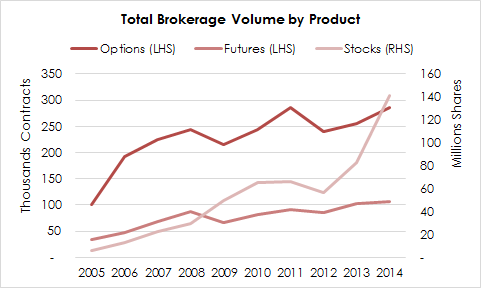
Figure 3. Source: Company statements, IOI Analysis
From this graph, it looks as though the first jump in profitability had to do with increased efficiency and volume in the option processing business and that the second likely jump had to do with the notable uptick in the number of shares processed on the stock side of the business.
Both businesses show a positive degree of operational leverage (i.e., profit grows and shrinks faster than revenue growth or shrinkage), though it seems that the Market Making segment is relatively more levered on an operational basis than the Brokerage business.
Conclusion
While not a full valuation of Interactive Brokers, this article has shown several of the most important drivers of value at the firm and the underlying sources of variability driving those drivers. This business does look interesting to us, and we will continue our analysis of this company in future articles.
FOOTNOTES:
[1] Because this is a brokerage firm, some interest expense involved in financing / trade facilitation activities are deducted from this amount. Interest from long-term corporate financing are not deducted from this amount.